Satellite data provide valuable support for IPCC climate report

Earlier this month, the Intergovernmental Panel on Climate Change (IPCC) published its latest assessment report laying out the accumulating evidence of the climate crisis. The report identifies Earth observing satellites as a critical tool to monitor the causes and effects of climate change and directly acknowledges the contribution of ESA’s Climate Change Initiative—a research program that draws on observations from multiple satellite missions.
It is the strongest and most significant IPCC report to date, incorporating advances in climate observations, analysis methods and modeling, and will be a key input to climate negotiations and decision-making.
Drawn from 14 000 scientific publications, the report concludes that “it is unequivocal that human influence has warmed the atmosphere, ocean and land” and warns that the changes to the state of many parts of the climate system are “unprecedented over many centuries to many thousands of years.”
Carbon dioxide is now at its highest level in at least two million years, and every ton adds to global heating. This is causing widespread and rapid changes to the atmosphere, ocean, cryosphere and biosphere.
Across many chapters, the report highlights the valuable contribution that satellites provide in tracking change and improving models for climate prediction. New and improved observational data records, which are longer since the IPCC’s previous report in 2013, support greater confidence in climate attribution assessments.
“The latest IPCC report clearly demonstrates the value of ESA programs in providing the evidence base for monitoring and understanding climate change.” said Josef Aschbacher, ESA’s Director General. “These hard facts are also highly appreciated by political decision makers in Europe and globally.”
The report explicitly acknowledges ESA’s Climate Change Initiative (CCI), which supports science teams to create long-term datasets spanning up to four decades for key aspects of the climate, known as Essential Climate Variables.
These variables underpin the “headline indicators” for climate monitoring. Fifteen scientists from ESA’s CCI program worked as contributing authors to the report, with five taking lead and coordinating author roles.

Sea ice
Remote sensing has revolutionized our knowledge of the world’s frozen areas, particularly near the poles where conditions make surface observations difficult.
September Arctic sea ice extent continues its long-term decline—a trend tracked from space since 1979. Model simulations shown in the report alongside the satellite-based observational dataset supported by ESA CCI predict that the Arctic sea will be practically “ice free” in summer at least once by 2050.
Glacier decline
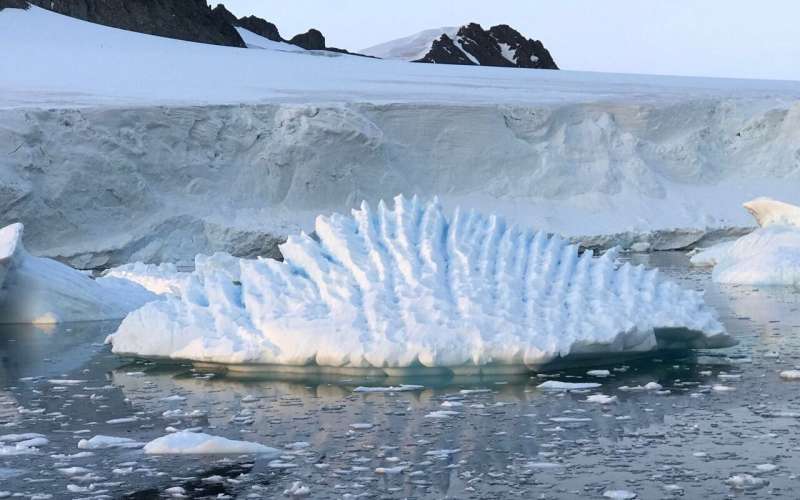
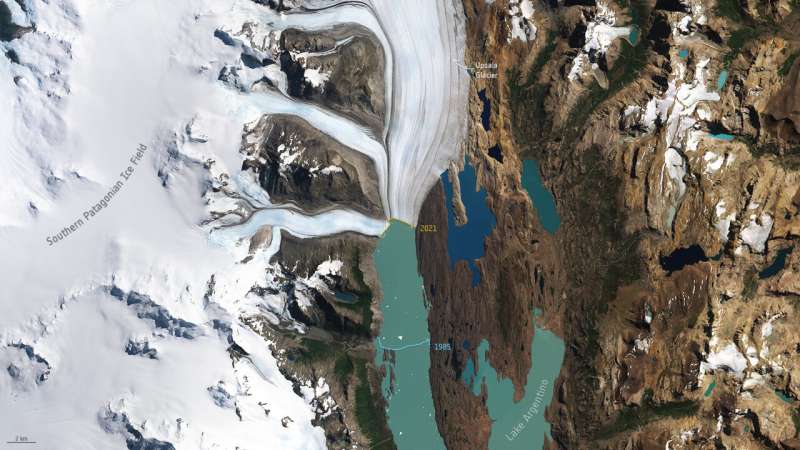
Most of the world’s glaciers are in retreat. Glacial ice loss has accelerated since the 1990s and is “very likely” driven by human influence. Satellite records, and research supported by CCI, which contribute to global glacier inventories, provide crucial lines of evidence in the report. These data track glacier mass balance and elevation changes across thousands of remote glaciers worldwide and assess their contribution to sea level rise.
Ice sheet melt
Whilst summer sea ice decline can be reversed within decades if greenhouse gas emissions are cut rapidly, many other changes will continue for hundreds to thousands of years. Most notably these are the melting of the ice sheets, sea level rise, ocean warming and acidification.

The Greenland Ice Sheet lost an estimated 4890 Gt of ice since the 1990s owing to surface melting and run-off. The Antarctic Ice Sheet loss is around 2670 Gt for a similar period, dominated by the melt of the West Antarctic Ice Sheet.
The new insights since the IPCC’s latest report have been enabled by combining observations with modeling to understand the surface processes driving ice loss. The rate of ice sheet loss is accelerating—the report notes a four-fold increase in ice sheet loss between 1992–1999 and 2010–2019.
Observations from multiple missions, including data from ESA’s ERS-1, ERS-2, Envisat and CryoSat missions, as well as the EU’s Copernicus Sentinel-1 mission, have proven critical for monitoring changes to the ice sheets, which together with glacier mass loss, are now the dominant contributors to global sea level rise. The ESA-supported Ice Sheet Mass Balance Inter-Comparison Exercise, also known as IMBIE, provided updated, reconciled satellite estimates of ice sheet contributions to sea level rise.
Permafrost and snow cover
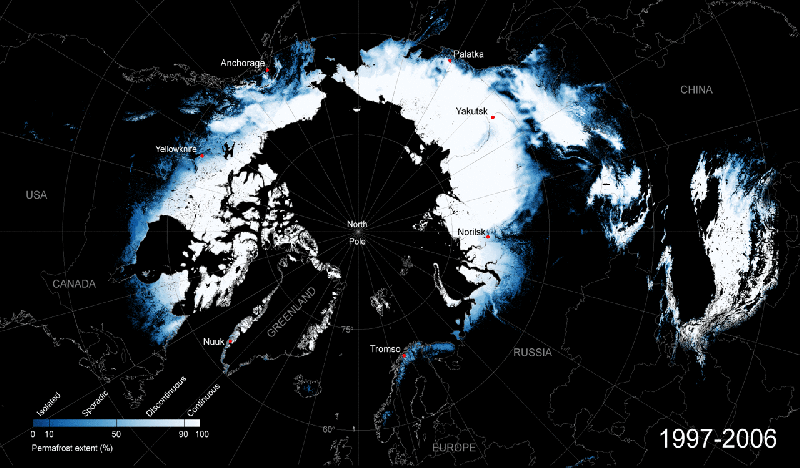
Substantial reductions in permafrost and seasonal snow cover are expected as the planet continues to warm. Both are the subject of study by CCI research projects, whose new data products such as snow water equivalent have made “substantial improvements to assessments of large-scale change.” Each project has released satellite-based records to characterize change across recent decades.
Sea level rise
Since 1901, sea level has risen by 20 cm, with the rate of increase accelerating to a high of 3.7 mm per year since 2006. Depending on future carbon emissions, mean sea level could rise a further 28–101 cm by 2100, and possibly by up to 2 m if the ice sheets become more unstable.
Satellite altimetry techniques provide a precise measurement of sea-level change. Global observations over the past three decades are consistent with the contribution of sea level rise from ice losses—in addition to the role of thermal expansion.
In order to closely monitor sea-level rise, the Copernicus Sentinel-6 Michael Freilich satellite was launched into orbit in November 2020. Using the latest radar altimetry technology, the satellite is set to provide a new overview of ocean topography and advance the long-term record of sea-surface height measurements that began in 1992 making it the most advanced mission dedicated to measuring sea-level rise.
Climate modeling
The relationship between Earth observations and climate models is closer in the current IPCC report than it was in 2013, with the importance of individual models weighted against how well they align with observations.
These are shown alongside satellite-based data for ice sheet dynamics, sea surface temperature, sea ice and sea level, as well as improved representation of cloud, soil moisture and ocean biogeochemistry and regional carbon budgets. Many of these comparisons and model outputs are supported by CCI datasets and members of the CCI Climate Modeling User Group, as well as projects such as RECCAP-2 that make use of multiple satellite datasets to improve intercomparisons and how climate variables are represented in Earth System models.
Looking ahead to the 2021 United Nations Climate Change Conference (COP26), ESA will be releasing new maps of global above ground biomass, which will help support the first global stocktake of the world’s climate mitigation and adaptation efforts as part of the goals of the Paris Agreement.
ESA astronaut joins glacier expedition in Alps
Citation:
Satellite data provide valuable support for IPCC climate report (2021, August 31)
retrieved 31 August 2021
from https://phys.org/news/2021-08-satellite-valuable-ipcc-climate.html
This document is subject to copyright. Apart from any fair dealing for the purpose of private study or research, no
part may be reproduced without the written permission. The content is provided for information purposes only.
For all the latest Science News Click Here
For the latest news and updates, follow us on Google News.

