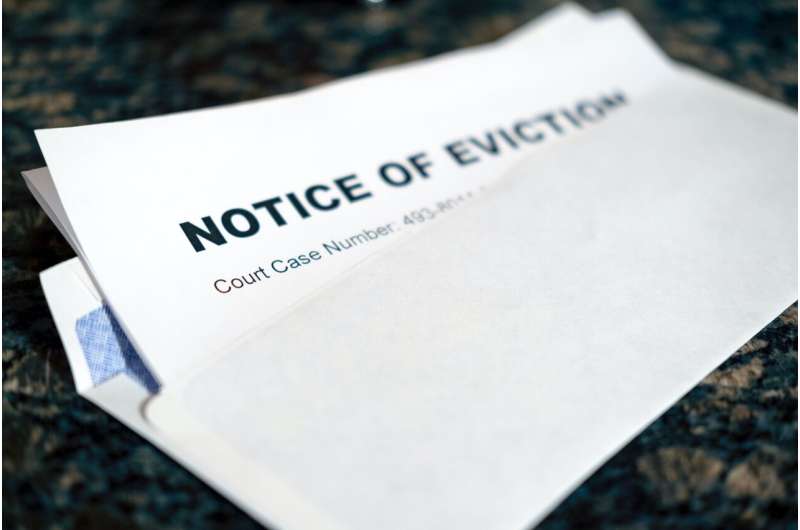
Online dashboard details surge in New York state eviction filings

New York state saw a resurgence of eviction proceedings after a nearly two-year moratorium ended in early 2022, with rates that year exceeding pre-pandemic levels in 40 of 62 counties, according to an ILR School analysis of census and court data.
Trends highlighted by the Cornell ILR Eviction Filings Dashboard for New York State raise red flags about the potential for higher crime, weakened social ties and diminished democratic participation in areas where eviction filings are increasing—consequences researchers have documented in other states, said Russell Weaver, director of research at the ILR Buffalo Co-Lab.
“The tools on the Eviction Filings Dashboard demonstrate that resurgent eviction filings are affecting all areas of New York state, but they are especially concentrated in low-income communities of color,” Weaver said. “It is therefore not surprising that numerous state legislators, as well as local governments across New York, are putting forward proposals to curb evictions and keep more New Yorkers in their homes.”
The dashboard is designed to help citizens, policymakers and nonprofits more easily visualize where eviction filings have occurred since 2018, their frequency and how filing patterns have changed over time. It leverages and complements city and district court data published by the New York State Unified Court System.
Several tools allow users to build fact sheets that provide context about the communities where families are facing eviction, including details about race and ethnicity, poverty level, housing costs, family type and housing types. Fact sheets can be generated for ZIP codes or for state Assembly and Senate districts.
Dashboard data shows that eight of the 10 counties with the highest eviction filing rates in 2022 were upstate, led by Rensselaer County with 10.7 filings per 100 renter households. Downstate, only Bronx and Suffolk counties ranked in the top 10, with rates of 9.5 and 8.6 filings per 100 renter households, respectively.
Additional topline findings from 2022 include:
- The Bronx was home to the ZIP code with the most eviction filings, with roughly one filing for every seven renter households. The community is composed almost entirely of renters, nearly 60% of whom are “cost-burdened” according to the federal definition, spending more than 30% of their gross monthly income on housing.
- Another high rate—one eviction filing for roughly every 5.4 renter households—was in a Buffalo ZIP code where the majority of renter families have children, and nearly half of the children live below the federal poverty level.
- Among state Senate districts, a pair in the Bronx (the 33rd and 32nd districts) had the highest eviction filing rates. They also ranked in the top five for renter cost-burden and poverty.
The dashboard is the latest resource advancing the ILR Buffalo Co-Lab’s mission to democratize data that can help New Yorkers understand and address persistent patterns of inequality, Weaver said. The Cornell Living Wage Atlas, released earlier this year, enables users to map where across the state residents earn living wages and in what jobs.
A coalition of community partners led by Housing Justice for All is using the Eviction Filings Dashboard to build support for policies that aim to reduce evictions. They include “good cause” protections against eviction; funding for a housing access voucher program; and a statewide right to counsel for tenants facing eviction.
For example, Weaver’s analysis shows that in court proceedings about potential evictions, 90% of landlords were represented by counsel, compared with less than 40% of tenants.
“The data highlight a huge power imbalance between landlords and tenants,” Weaver said, “and suggest that access to legal counsel could be one of the big drivers of evictions in New York state.”
Weaver said research in places including Boston, Philadelphia and Ohio has found that evicted households typically need to relocate multiple times, often leading to lower-quality housing in more precarious neighborhoods. Family dislocations weaken neighborhood bonds and result in higher crime. And displaced tenants are less likely to vote.
“The data we have from New York state suggests that those findings are relevant here as well,” Weaver said. “If evictions eclipse pre-pandemic rates, what will that mean for safe communities, cohesive communities and democratic participation in society?”
More information:
Dashboard: blogs.cornell.edu/nysevictions/
Citation:
Online dashboard details surge in New York state eviction filings (2023, March 22)
retrieved 23 March 2023
from https://phys.org/news/2023-03-online-dashboard-surge-york-state.html
This document is subject to copyright. Apart from any fair dealing for the purpose of private study or research, no
part may be reproduced without the written permission. The content is provided for information purposes only.
For all the latest Science News Click Here
For the latest news and updates, follow us on Google News.

