New study finds shifting climate regions leading to hotter, drier conditions across Kenya

New research published in Regional Environmental Change has shown that as climate zones shift toward hotter and drier conditions, ecological diversity will decline, posing a major threat to terrestrial ecosystems with far-reaching social and ecological impacts.
The study, “Shifting climate zones and expanding tropical and arid climate regions across Kenya (1980-2020),” was published online on April 5.
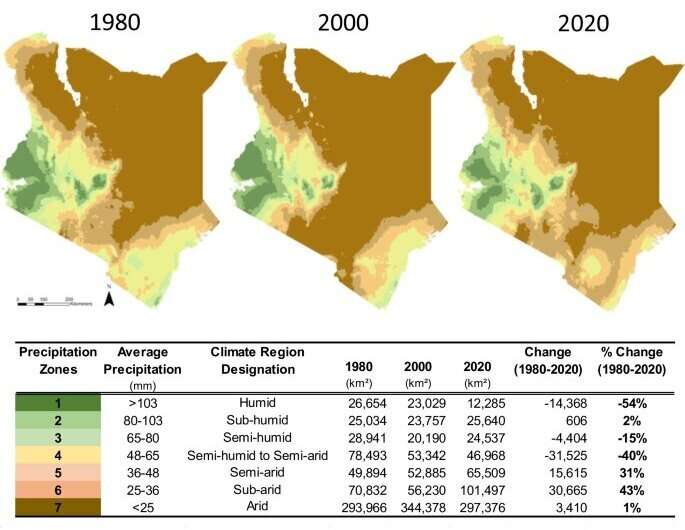
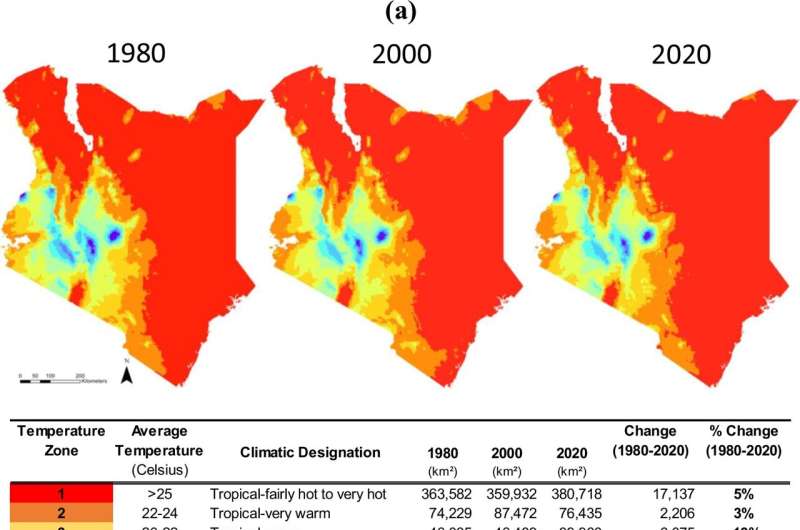
The research team analyzed Kenya’s geographic distribution and arrangement of climate zones between 1980 and 2020. Over that time, tropical climate regions expanded from 91 to 93% with over 13,000 square kilometers shifting from alpine and temperate regions to tropical ones, and arid climate regions expanded from 72 to 81%, a roughly 50,000 km2 shift from humid and semi-humid-to-semi-arid to arid regions.
“With a better understanding of how climate shifts occurred in an environment like Kenya, we can estimate how food security will be impacted in other regions with similar geographic patterns,” said Enbal Shacham, Ph.D., professor of behavioral science and health education at Saint Louis University’s College for Public Health and Social Justice and acting director of strategic initiatives for the Taylor Geospatial Institute.
The first author is Ted J. Lawrence, a former post-doctoral fellow at the Taylor Geospatial Institute. Shacham is the paper’s senior author.
The research team looked at how temperature and precipitation trends changed over time and how the geographic distribution and arrangement of climate zones in Kenya shifted due to those trends.
The team focused on Kenya because rain-fed agriculture is central to the country’s economy and it is a key food-producing country for the East African region. The findings highlight the urgent need for adaptation strategies that take into account the impacts of shifting climate zones on food security and the livelihoods of millions of people. They also underscore the importance of developing land use and ecosystem management practices that can help mitigate the impact of climate change and maintain ecological diversity.
Data showed that in addition to the 1-degree Celsius increase in temperature, there was a decrease in precipitation during the country’s primary rainy season (spring) and an increase in precipitation in the secondary rainy season (fall).
An area of 76,346 square kilometers shifted from cooler to hotter zones, while 1,298 square kilometers shifted from hotter to cooler zones. Human-induced climate change significantly alters the spatial-temporal patterns of climate zones, driving agricultural land use and ecosystem change. Changes to the climate zone alter the biological and physical properties of the ecosystem, leading to a change in what an ecosystem can support.
The researchers reviewed data from a variety of sources, including:
- Average monthly and annual temperature precipitation time series of Kenya between 1975 and 2020, obtained from the Climate Change Knowledge Portal
- Georeferenced average monthly temperature and precipitation across Kenya with a 5-kilometer resolution during 1976-1980, 1996-2000 and 2016-2020 from the TerraClimate dataset
- A digitized version of the georeferenced boundaries of the Kenyan ACZs documented in 1982 and obtained through the IGAD Climate Prediction and Application Centre Portal.

The team assessed the average annual and seasonal temperature and precipitation trends to understand Kenyan climate change between 1975-2020 before creating climate reference maps. The maps represented temperature and precipitation zones in 1980, 2000 and 2020.
Human-induced climate change in Kenya resembles global trends, the research found, with certain regions being more sensitive to the forces of climate change.
As climate zones shift toward hotter and drier conditions, ecological diversity will decline, posing a major threat to terrestrial ecosystems with far-reaching social and ecological impacts.
Information on climate change and shifting climate zones in this paper can be used to investigate a variety of ecological questions and aid in the effort to reach the United Nations’ Sustainable Development Goals.
More information:
Ted J. Lawrence et al, Shifting climate zones and expanding tropical and arid climate regions across Kenya (1980–2020), Regional Environmental Change (2023). DOI: 10.1007/s10113-023-02055-w
Citation:
New study finds shifting climate regions leading to hotter, drier conditions across Kenya (2023, April 20)
retrieved 20 April 2023
from https://phys.org/news/2023-04-shifting-climate-regions-hotter-drier.html
This document is subject to copyright. Apart from any fair dealing for the purpose of private study or research, no
part may be reproduced without the written permission. The content is provided for information purposes only.
For all the latest Science News Click Here
For the latest news and updates, follow us on Google News.

