Estimating heat wave frequency and strength: A Chicago case study

Urbanization and human-caused climate changes have led to increases in heat events around the world. For example, in July 2012, an extreme heat wave hit the Chicago area, causing temperatures to skyrocket to 40 degrees Celsius (104 degrees Fahrenheit) and above. Chicago, like most cities, is affected by urban heat islands (UHIs), which occur when changes in land cover create spaces that are warmer than their surrounding area. Satellite measurements can be used to inform models to characterize the intensity of UHIs, yet satellite techniques have some limitations—expensive sensors and low temporal resolution, among other drawbacks. But quantifying the intensity of UHIs could help public health officials and city planners learn to mitigate the impacts of future heat waves.
In a new study, Chen et al. used numerical modeling and real-world measurements to assess the impacts of the Chicago heat wave on the city and the surrounding region. The researchers used the National Center for Atmospheric Research’s Weather Research and Forecasting (WRF) model—a framework that’s commonly used for both atmospheric research and weather forecasting—together with the High-Resolution Land Data Assimilation System, which adds information about soil moisture to the WRF.
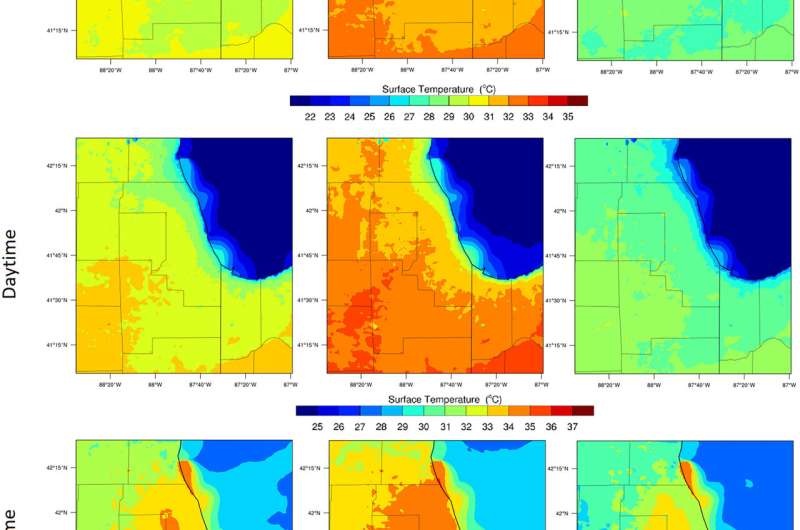
The authors found that application of the Multi-Layer Urban Canopy Model (MLUCM) in WRF provided the best estimates of the heat wave’s effects on Chicago and the surrounding areas. Using data and measurements taken during the 2012 heat wave, the researchers found that daytime temperatures in urban areas were around 3 degrees Celsius higher than usual during the heat wave, whereas rural temperatures were about 4 degrees Celsius higher. They estimated that urban heat island effects led city temperatures to be 1.44 degrees Celsius—2.83 degrees Celsius higher than they otherwise would have been. In urban areas, the excessive heat factor (a statistical index to represent heat stress) reached 50 degrees Celsius—a level likely to cause health problems.
Urban and rural areas both experienced advantages and disadvantages during the heat wave. The city got a bit of a reprieve because of the breeze from Lake Michigan—a benefit not experienced in rural areas—but the city’s nighttime temperature still remained dangerously hot. Rural areas, on the other hand, benefited from the heat-mitigating effects of vegetation. People in rural areas are typically less adapted to high temperatures and lack the medical resources of city residents, leaving rural residents potentially less able than city residents to cope with the heat wave’s health impacts.
Incorporating benefits of rural areas, such as vegetation and permeable surfaces, into urban centers will help keep these areas livable during hot summers. Conversely, providing supplemental medical support to rural areas could help residents ride out future heat waves.
As the mercury rises, the urban heat penalty grows, especially at night
Kaiyu Chen et al, Estimating Heat‐Related Exposures and Urban Heat Island Impacts: A Case Study for the 2012 Chicago Heatwave, GeoHealth (2021). DOI: 10.1029/2021GH000535
This story is republished courtesy of Eos, hosted by the American Geophysical Union. Read the original story here.
Citation:
Estimating heat wave frequency and strength: A Chicago case study (2022, March 10)
retrieved 10 March 2022
from https://phys.org/news/2022-03-frequency-strength-chicago-case.html
This document is subject to copyright. Apart from any fair dealing for the purpose of private study or research, no
part may be reproduced without the written permission. The content is provided for information purposes only.
For all the latest Science News Click Here
For the latest news and updates, follow us on Google News.

